
Project overview
Client: Steer
Role: Senior UX/UI designer
Project duration: 4 weeks
Platform: Web
Background
The Urban Dynamic Model (UDM) is a simulation of how transport, people, employers and land use interact over long periods of time. It was developed by Steer to help answer questions about how to invest in major infrastructure in order to best support the local economy and has been used on project work for over 15 years. The current version of the model played back data onscreen but each piece of data was shown individually without any relationship to another and the language and terminology wasn’t very customer friendly and relied on a lot of prior expertise and knowledge.
My role
I was asked to design a new online interactive version of the UDM that could be used as a marketing tool to demonstrate what could be done with the model to potential clients, including local councils, with a view to clients commissioning use of the model in future projects. The project team consisted of myself (senior UX/UI designer), a developer, a product owner and a project manager.
Planning and concept phase
Initially we ran workshops with stakeholders and clients who were aware of the tool to generate requirements and ideas. These sessions also enabled us to understand what the tool was capable of and how it worked.
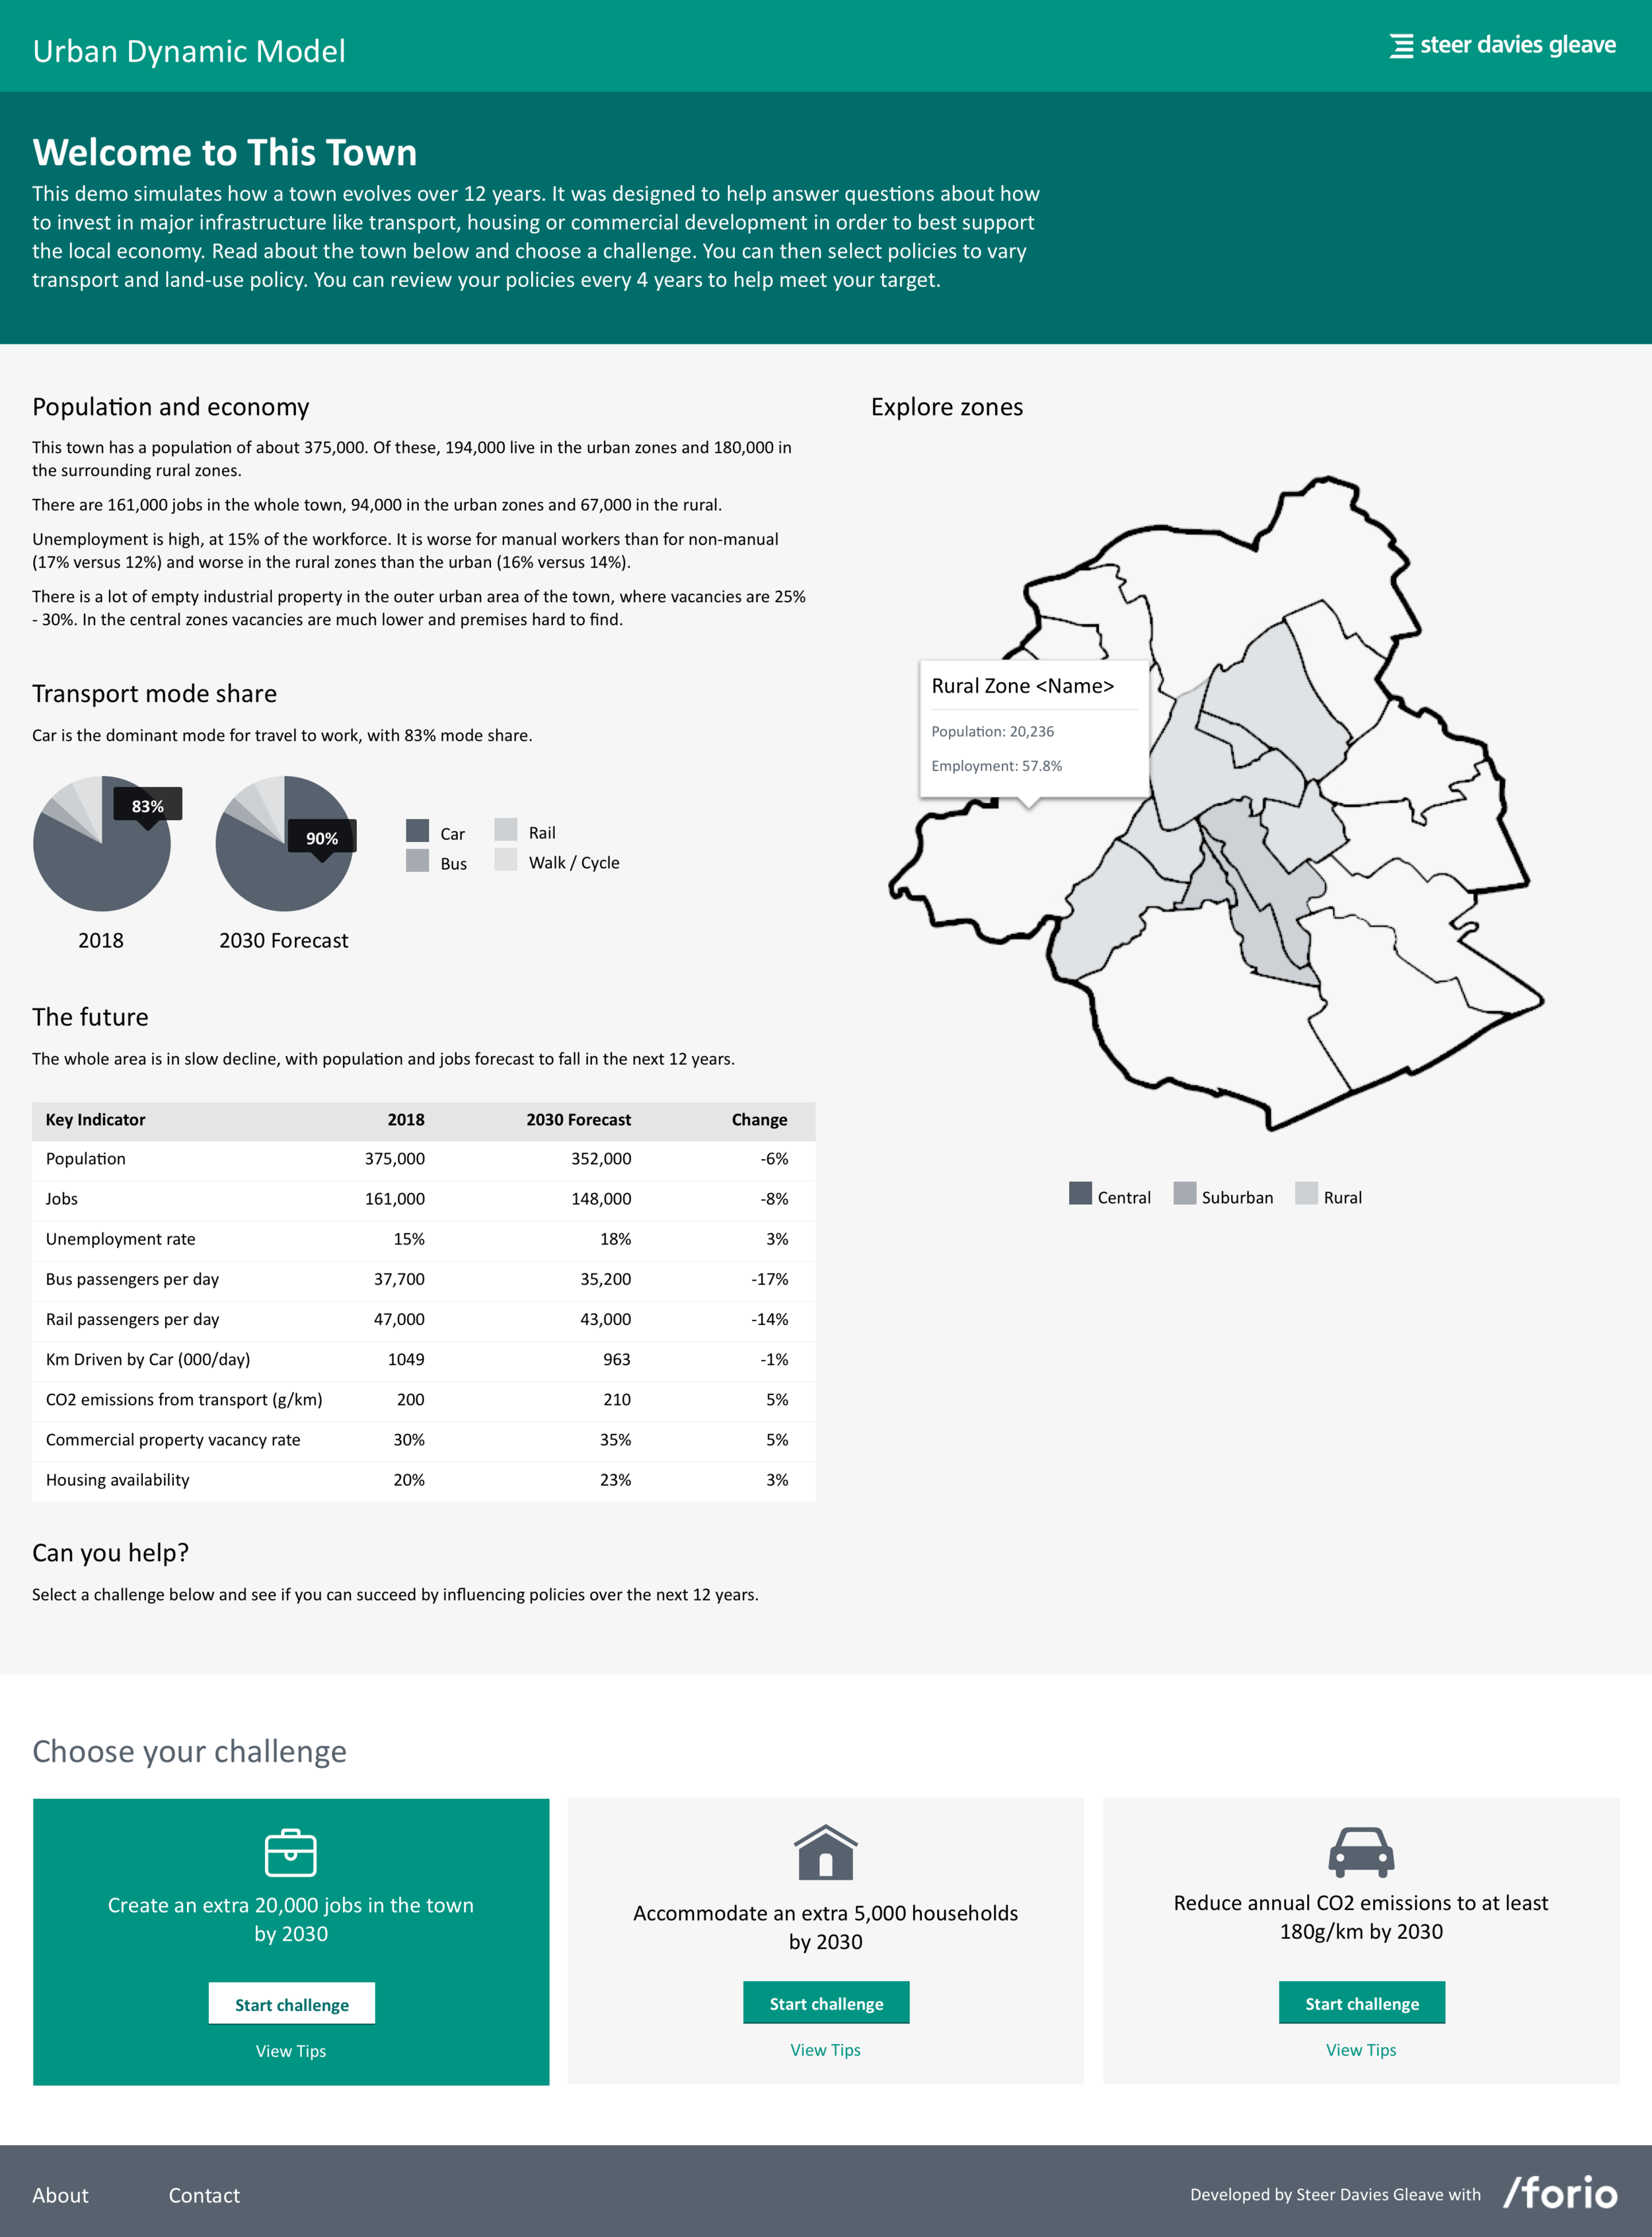
After these sessions we came up with the idea of allowing customers to choose how to invest their budget to see the impact on employment, housing and the environment over 12 years. We introduced challenges to give the customer a particular target to focus on e.g. create an additional 10,000 jobs over the duration of the simulation.

I created a simple user flow to visualise the concept.
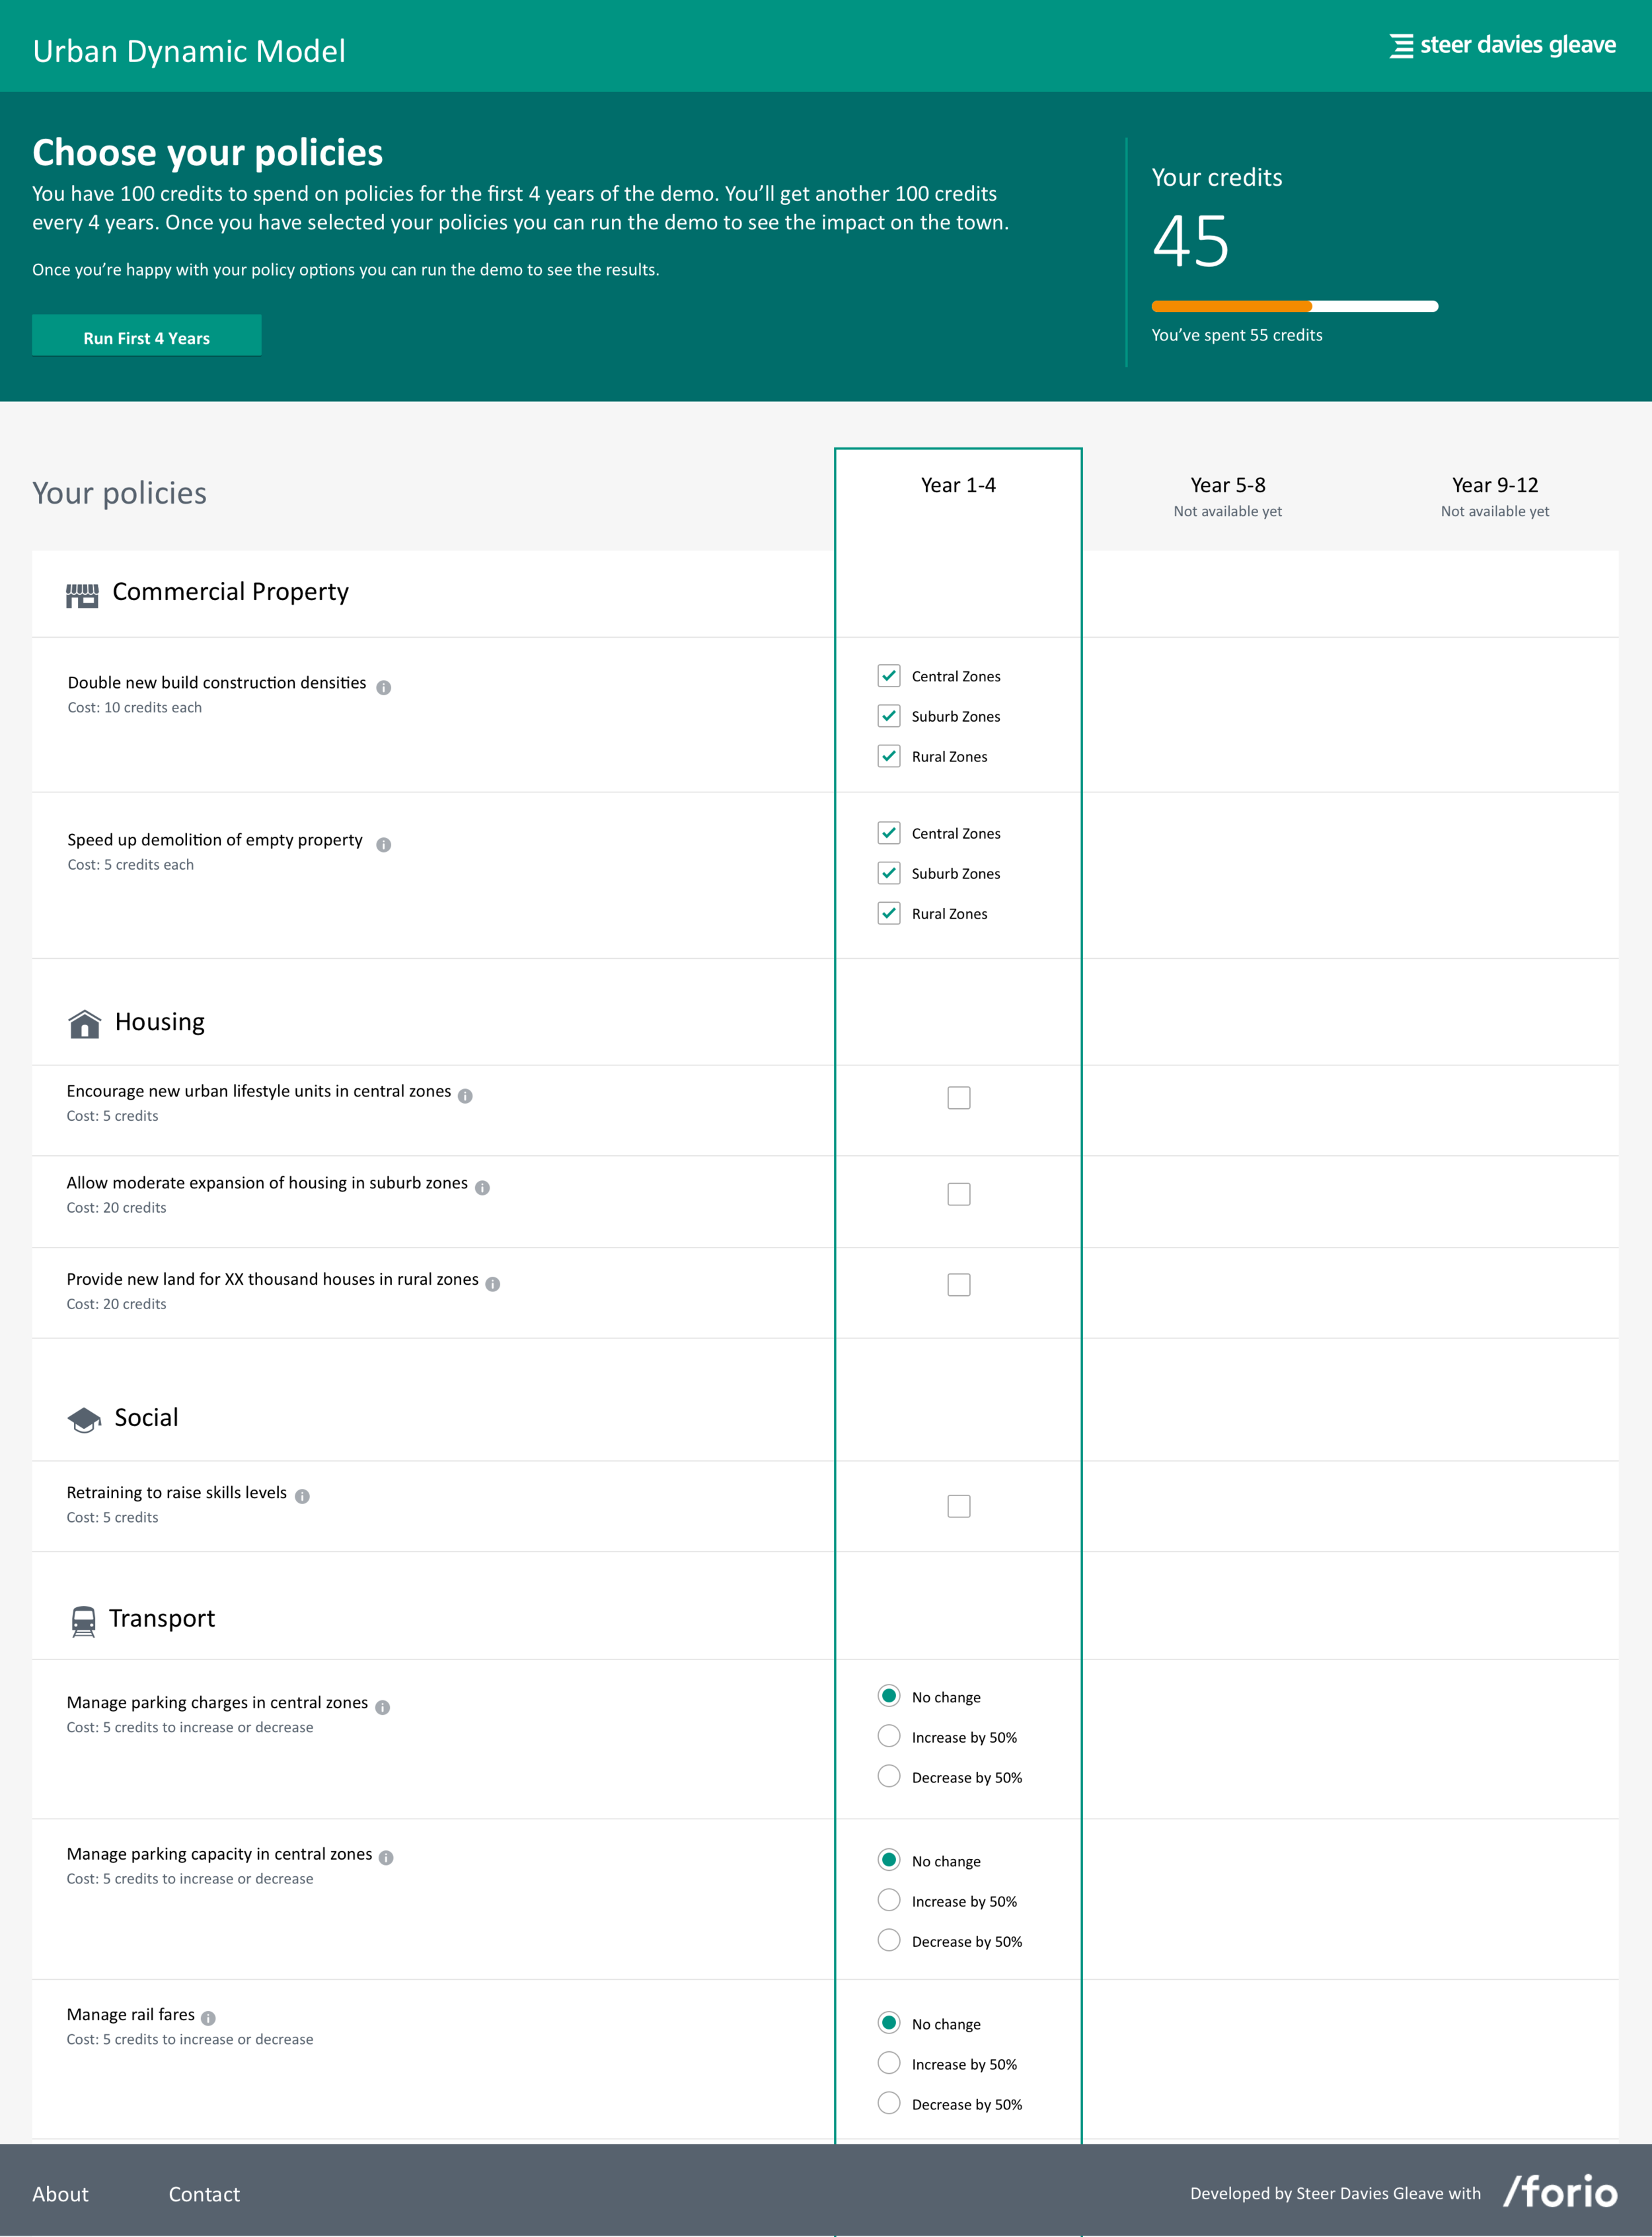
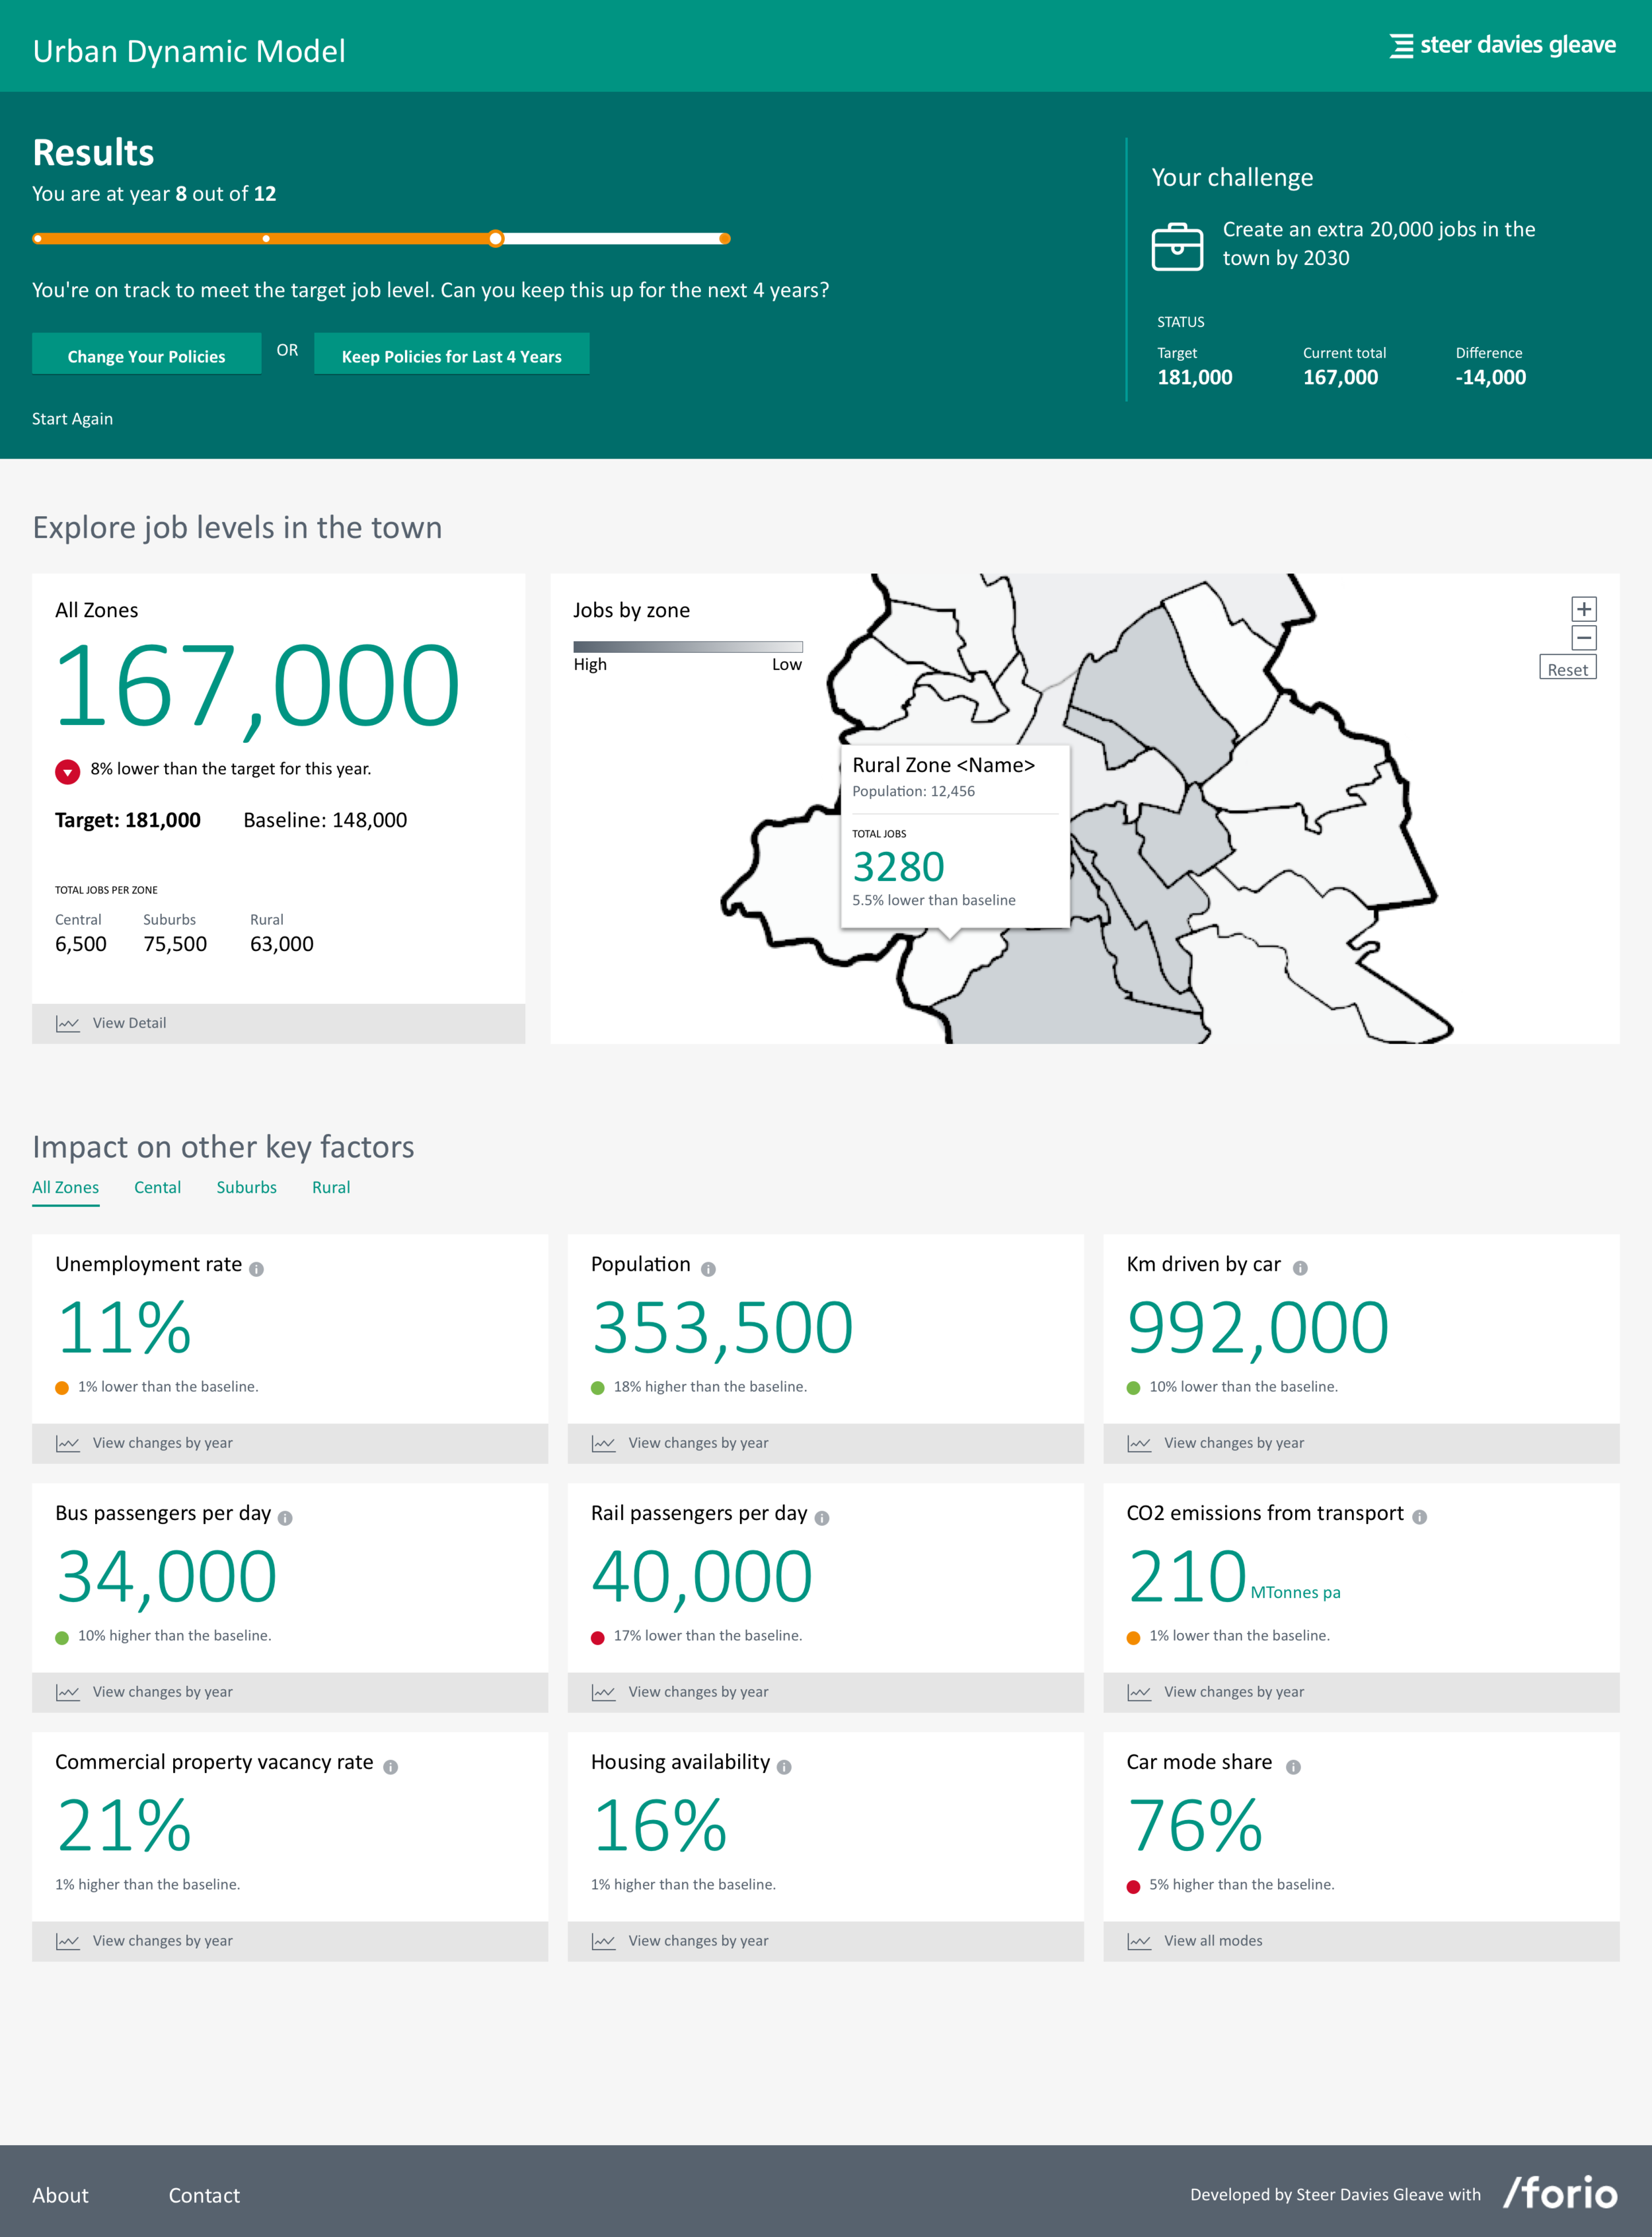
Rather than allow endless investment, which would make the challenge too easy, we introduced a fixed amount of credits so that choices had to made about where to spend them. During the simulation, after every four years, we presented stats and information about the impact of these policy choices, and allowed intermittent policy adjustments to be made before progressing through the next four years and then finally seeing the impact of their choices on their chosen target after 12 years.

Initial concept sketches
Design, prototyping and build
I quickly moved onto sketching concepts to validate ideas before moving onto detailed designs and an interactive prototype, made with Sketch and InVision. I shared this with the workshop attendees, and used their valuable feedback and insight to help refine the design. Alongside the design work the backend build and integration had already begun. I worked directly with the developer to continuously refine the product and the customer facing UI.
One of the main things I wanted to focus on was making the language customer friendly which included removing jargon and acronyms. The previous version of the model didn’t provide any guidance to support customers throughout the demo so we included a traffic light system to show customers how they were progressing at a glance. Working out the logic for this was fairly complex as we had to make it appropriate for each type of data. For example, a figure that was higher than the baseline could be either negative or positive depending on the statistic being measured, e.g. we wanted to see the total number of jobs increase above than the baseline, and we also wanted to see the total distance driven by cars decrease below the baseline.
I loved having lots of data to play with, and it was fun presenting it in new and interesting ways.
Project challenges
The main challenge was making sense of the vast amount of data and deciding what would be the most useful and interesting to customers. There were also limitations with what we could do with the model itself and frequent sessions with the product owner helped us to remain focussed on what was achievable at this time without requiring changes to the underlying model.
Time and budget were tight but an agile approach with weekly sprints and demos ensured that we were able to address issues as they came up and manage stakeholder expectations.
Future plans
During the project we came up with lots of ideas for new features, in particular different ways to view the stats and options to save and retrieve your demo if for example you were using the tool for a real project. As these features were out of scope we developed a product roadmap so that these ideas were not lost. This initial release will hopefully be used to secure future funding for enhancements and new features and the build and design were approached in a way that make the model scalable and flexible.
“It’s beautiful. And accessible. And yet not too light, plenty of relationships and data trends to study there. Nice work!”